After several losses, the results alone may not tell you whether your decisions are improving. To see how long results can hide a small advantage, we will give a player a 55% chance of winning each match and calculate how often they still finish with more losses than wins.
A small edge, over 20 matches
Imagine that you have a 55% chance of winning each match. Your opponent has 45%. Keep those chances the same throughout, and make each match independent of the others.
Over 20 matches, you would expect 11 wins and 9 losses. But 11 is an average across many such sessions. An individual evening can end quite differently.
In this model, the chance of finishing with more losses than wins is 24.9%, or roughly one evening in four.
Another 15.9% end level at 10–10. You finish ahead 59.1% of the time. These percentages are rounded, so they do not quite add to 100.
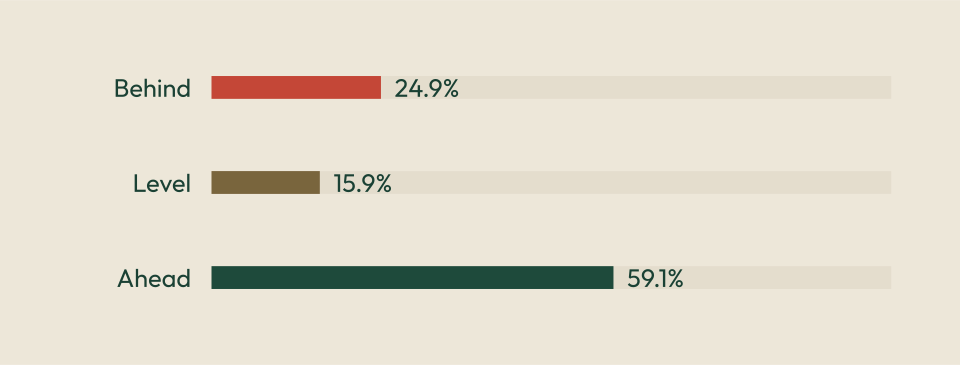
Here, an “evening” means a fixed set of 20 matches of the same length. Each whole match counts as one win or loss, whatever its final score. Finishing behind means nine wins or fewer. It does not mean losing 20 in a row.
Give 100 evenings the same starting chance
Change the advantage or the number of matches, then run the experiment. The calculated chances stay fixed for your settings. You get 100 newly simulated evenings each time.
Try 100 evenings
Model: independent matches with a fixed win chance. These settings are assumptions, not ratings.
Finish behind24.9%
Finish level15.9%
Finish ahead59.1%
− behind · = level · + ahead. Each square is one simulated evening.
The same win chance can produce runs of losses, early leads that disappear and recoveries cut short by the end of a session. The simulated player has the same advantage in every case; the different records come from the random draws.
Even 100 matches leave room for disappointment
Keep the 55% win chance and extend the session to 100 matches. The chance of ending behind falls to 13.5%, about one in seven. More results help an advantage show through, but they do not guarantee a winning record over a chosen stretch.
Our simulated player never gets annoyed enough by a loss to start playing differently. Their chance of winning stays at 55% in every match, and they can still finish behind after 100 matches.
The size of the edge matters too. With a 60% win chance in every match, the chance of finishing behind after 20 is 12.8%. After 100, it is 1.7%.
These are comparisons between fixed sets of matches. If you keep extending a session because you are losing, you have changed the question the calculation answers.
The next match does not owe you a win
In our model, your chance of winning the next match stays at 55% whether you have just lost or won the previous five. Those past results do not change the probability of the next one.
The same distinction appears in the consecutive-doubles puzzle: a surprising run behind you does not change an independent event ahead of you.
Real players are more complicated. You might tire, change opponents, switch match lengths or start making rushed decisions. That is why the 55% is an assumption for this experiment, not a claim about your rating or your next game.
What should you take from a losing evening?
A losing record alone cannot tell you whether you played badly, had an unlucky run, or experienced some of both.
Pick a few decisions you were unsure about. Look at what you were trying to achieve and what the alternatives offered. Would you choose the same play again, before knowing the next roll?
We used the same approach in our test on recorded tournament decisions: compare the moves played with the coach’s advice, without treating a win as proof that a recommendation was good.
Inside a match, taking a double can put the whole result on the current position, while passing can leave other games to play. Our cube example follows those two routes from the same board.
If you want a starting point for reviewing your own choices, the five game plans give you a way to describe what your checkers were meant to do.
Copy this link to share: https://cubebackgammon.com/blog/play-well-keep-losing/
The broader relationship between skill and short-run results is well established. We consulted and credit Phil Simborg’s “Luck vs. Skill in Backgammon”. The writing, numerical example, interactive experiment and social graphics here were created for CUBE Backgammon.
About the calculation
We use the binomial distribution: a fixed number of independent matches, each with the same assumed probability of a win. A session finishes behind when wins are fewer than half the matches; an even split is reported separately. The headline probability is 24.92893598% for 20 matches with a 55% win chance each. To find the chance of finishing behind, we add up the probabilities of all the losing records. The result does not come from the 100 simulated evenings shown in the experiment.
This is a model of match results, not a simulation of checker play or a measurement of CUBE Backgammon users. It does not convert Elo or performance ratings into win probabilities. Match length, opponents, fatigue and skill are held fixed by assumption. It measures the record at the end of a fixed session, not the longest losing streak, time spent behind, or a guarantee about any particular player. Every match has equal weight.